Evaluating IKEA Website
Part of IKEA's website called "Design your space"
Contributor : Muchammad Ersan, Arnold A., Leonardo E., Margareta, Rio Kurnia
Period : April - May 2019 (8 Weeks)
Ikea’s design your space website (accessed on March)
Overview
Conducting a usability evaluation on a part of IKEA's website called "Design your space". We did two kinds of evaluation, which are Lab Evaluation using Eye Tracking and Evaluation in the wild.
Problem Statement
The University of Melbourne has found that some aspects of the IKEA website have become ineffective and can be changed.
We therefore choose to evaluate the "Design your space" part of IKEA website and use our knowledge of user experience to suggest some solutions.
Objectives & Goals
To test how usable the current version of "Design your space" for general tasks
Identify the ineffective parts of "Design your space
Propose several improvements that could be made to the ineffective areas
Methods
The methods used in this usability test were those of the user-based method, as we performed this test on multiple users.
Interview

Observation

Eye-Tracking
Quantitative & Qualitative

Criteria For potential users
Users who want to bought furniture
Users who have been to IKEA
Users experienced in interior design
Test procedures
Send out a screening questionnaire to potential participants
Schedule a test time with the participants who are eligible for this study
Inform the participants regarding test procedures as well as ethical considerations (as we were collecting and recording audio, eye tracking, face recording, and data from questionnaires) and request them to sign a printed consent form
Start recording and introduce test protocol to participant, encouraging them to “think aloud” while doing the tasks.
Stop recording at the end of the tasks and request participant to fill in a post-test questionnaire
Material
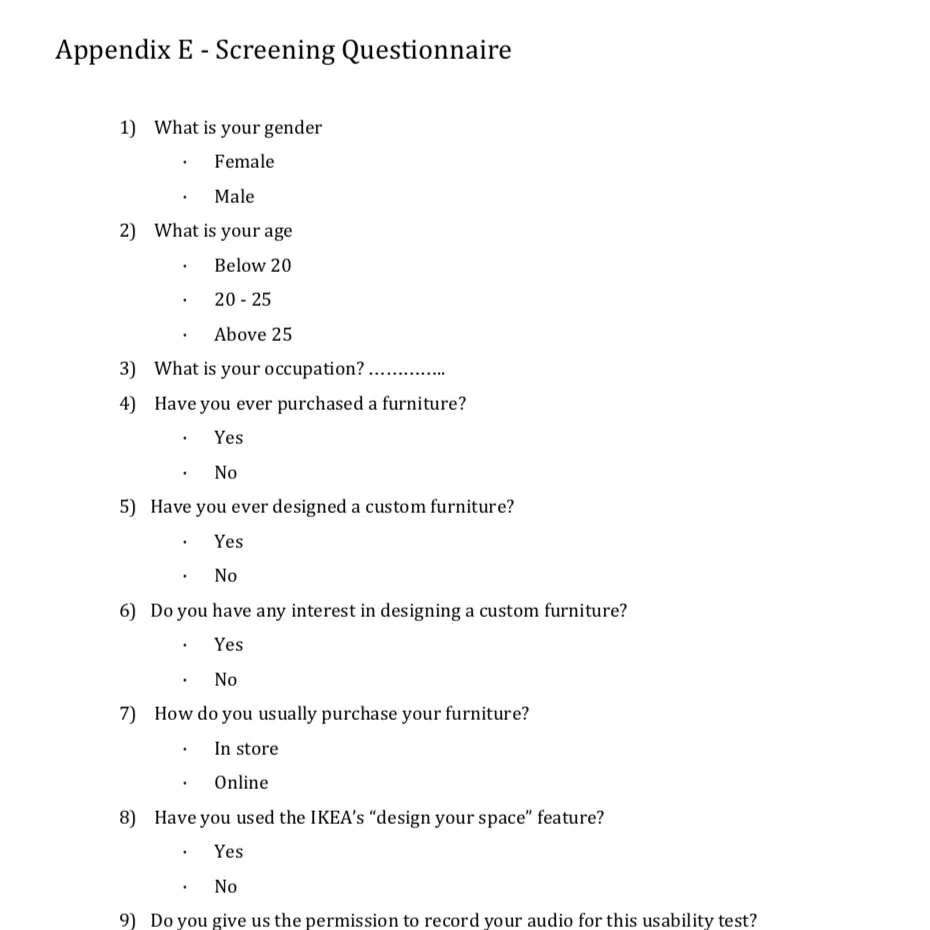
Preview of screening questions
Screening questionaries
The purpose of this questionaries was for find the potential users and collect the quantitative data.
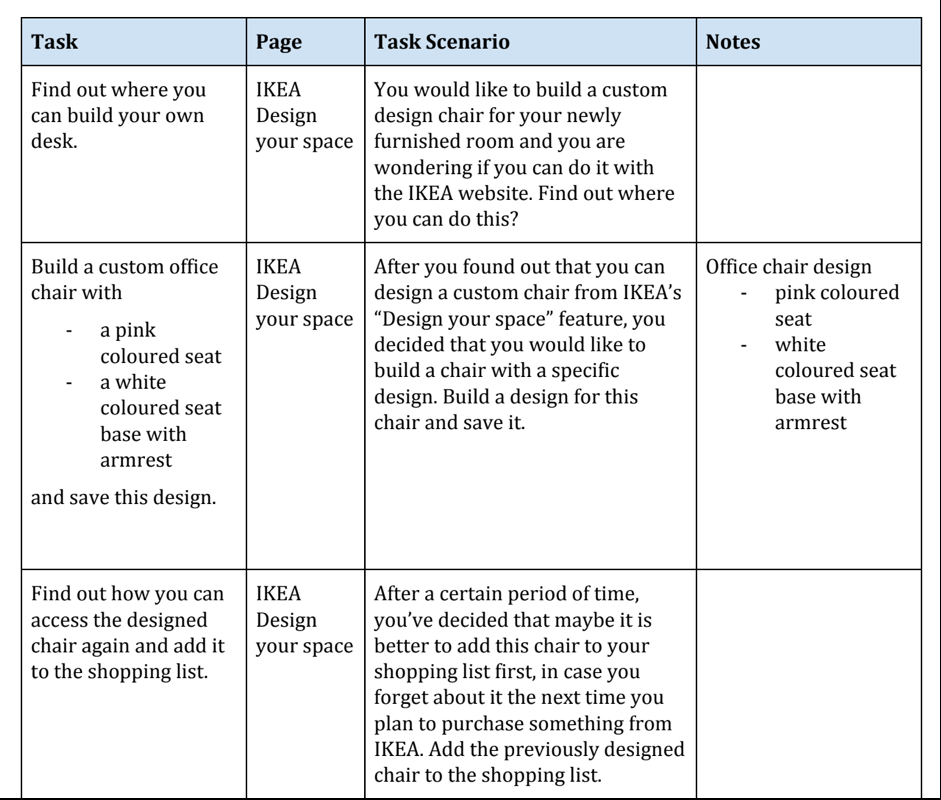
Preview of the tasks scenario
Scenario for testing
The participants should finish every task, and they would have an interview session right after they finished every task. The researchers also motivated the participant to "think aloud" during the test for collecting qualitative data.
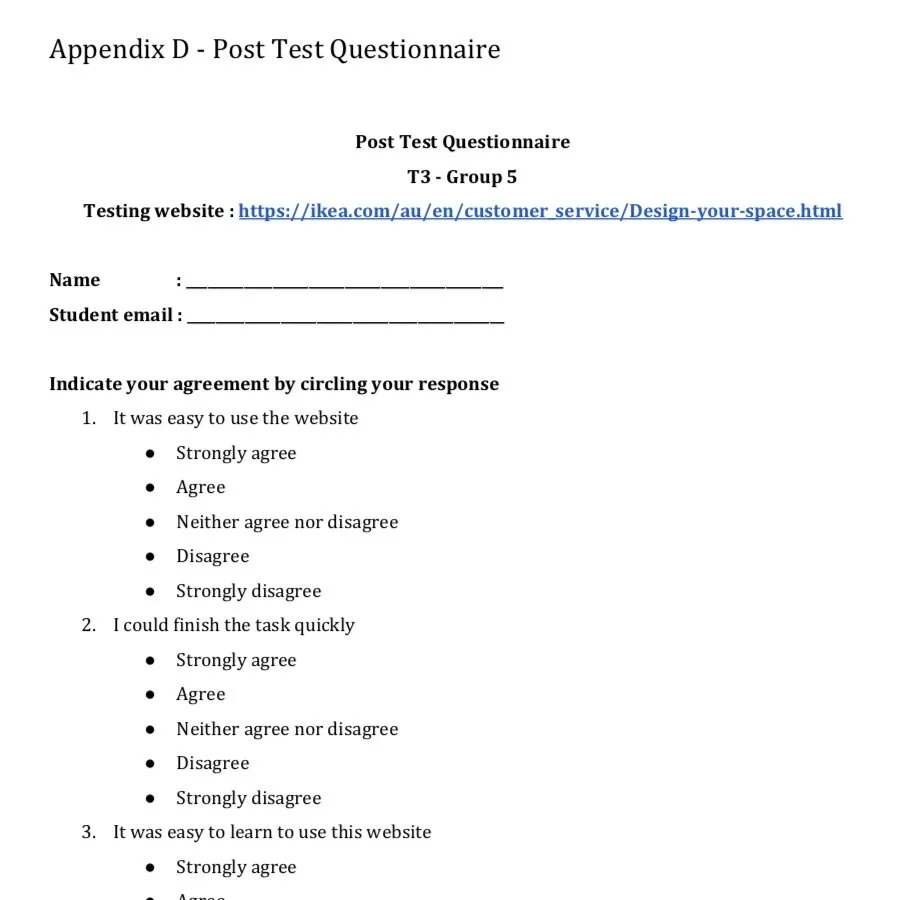
preview of post test questionnaire
Post questionaries
The purpose of this questionnaires were to collect the quantitative about how the user feels after finishing the tasks. This data could be important for analysis purpose.
Analysing data
We conducted the scenario tests and collected 2 type of data, quantitative and qualitative data. Qualitative data was obtained through observation and using “think aloud” protocol, while quantitative data was measured mostly by using issue-based metrics. Here's the example of data that we collected;
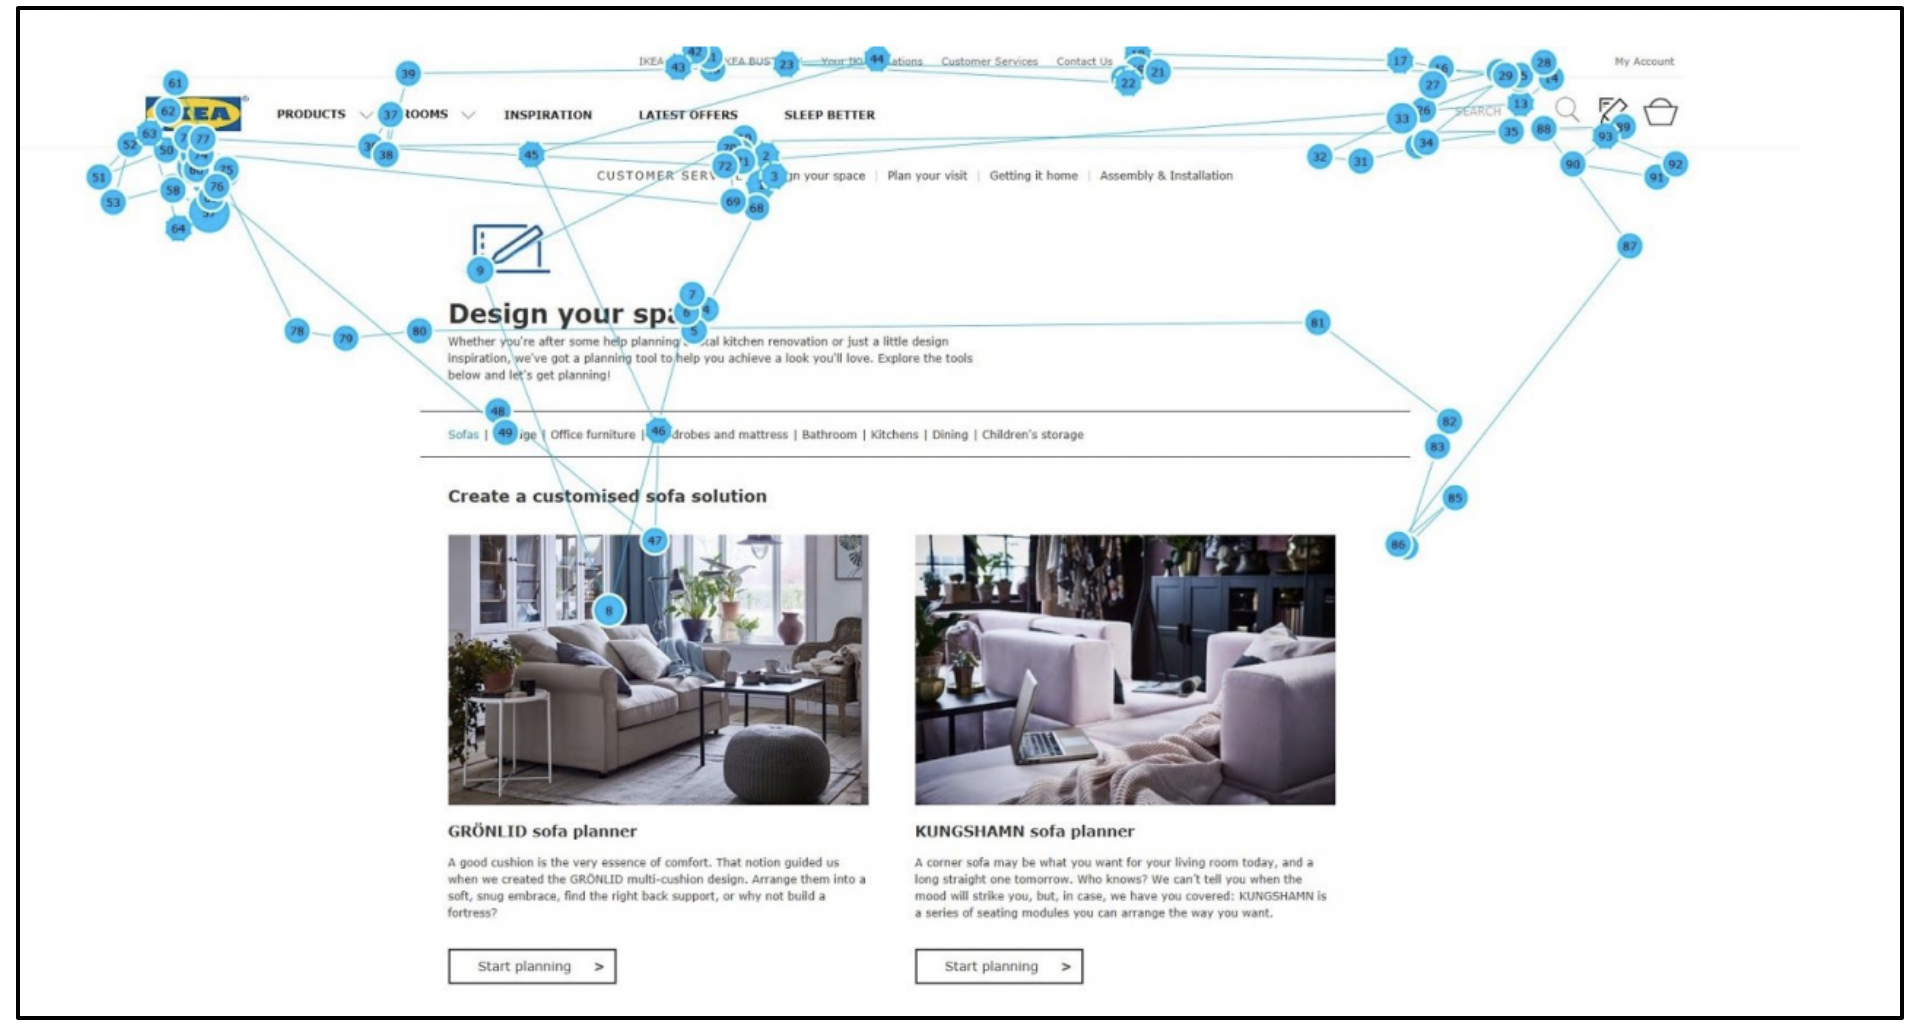
Gaze map data
Gaze map data captured by eye tracker
This qualitative data indicated the location, order and time spent on looking at the website page. By using this data we could analysed the sequence order while the user's looking at the detail on corresponding page, the target location of the gaze, and the time spent looking at it. The longer user look at the details, the larger the circle.
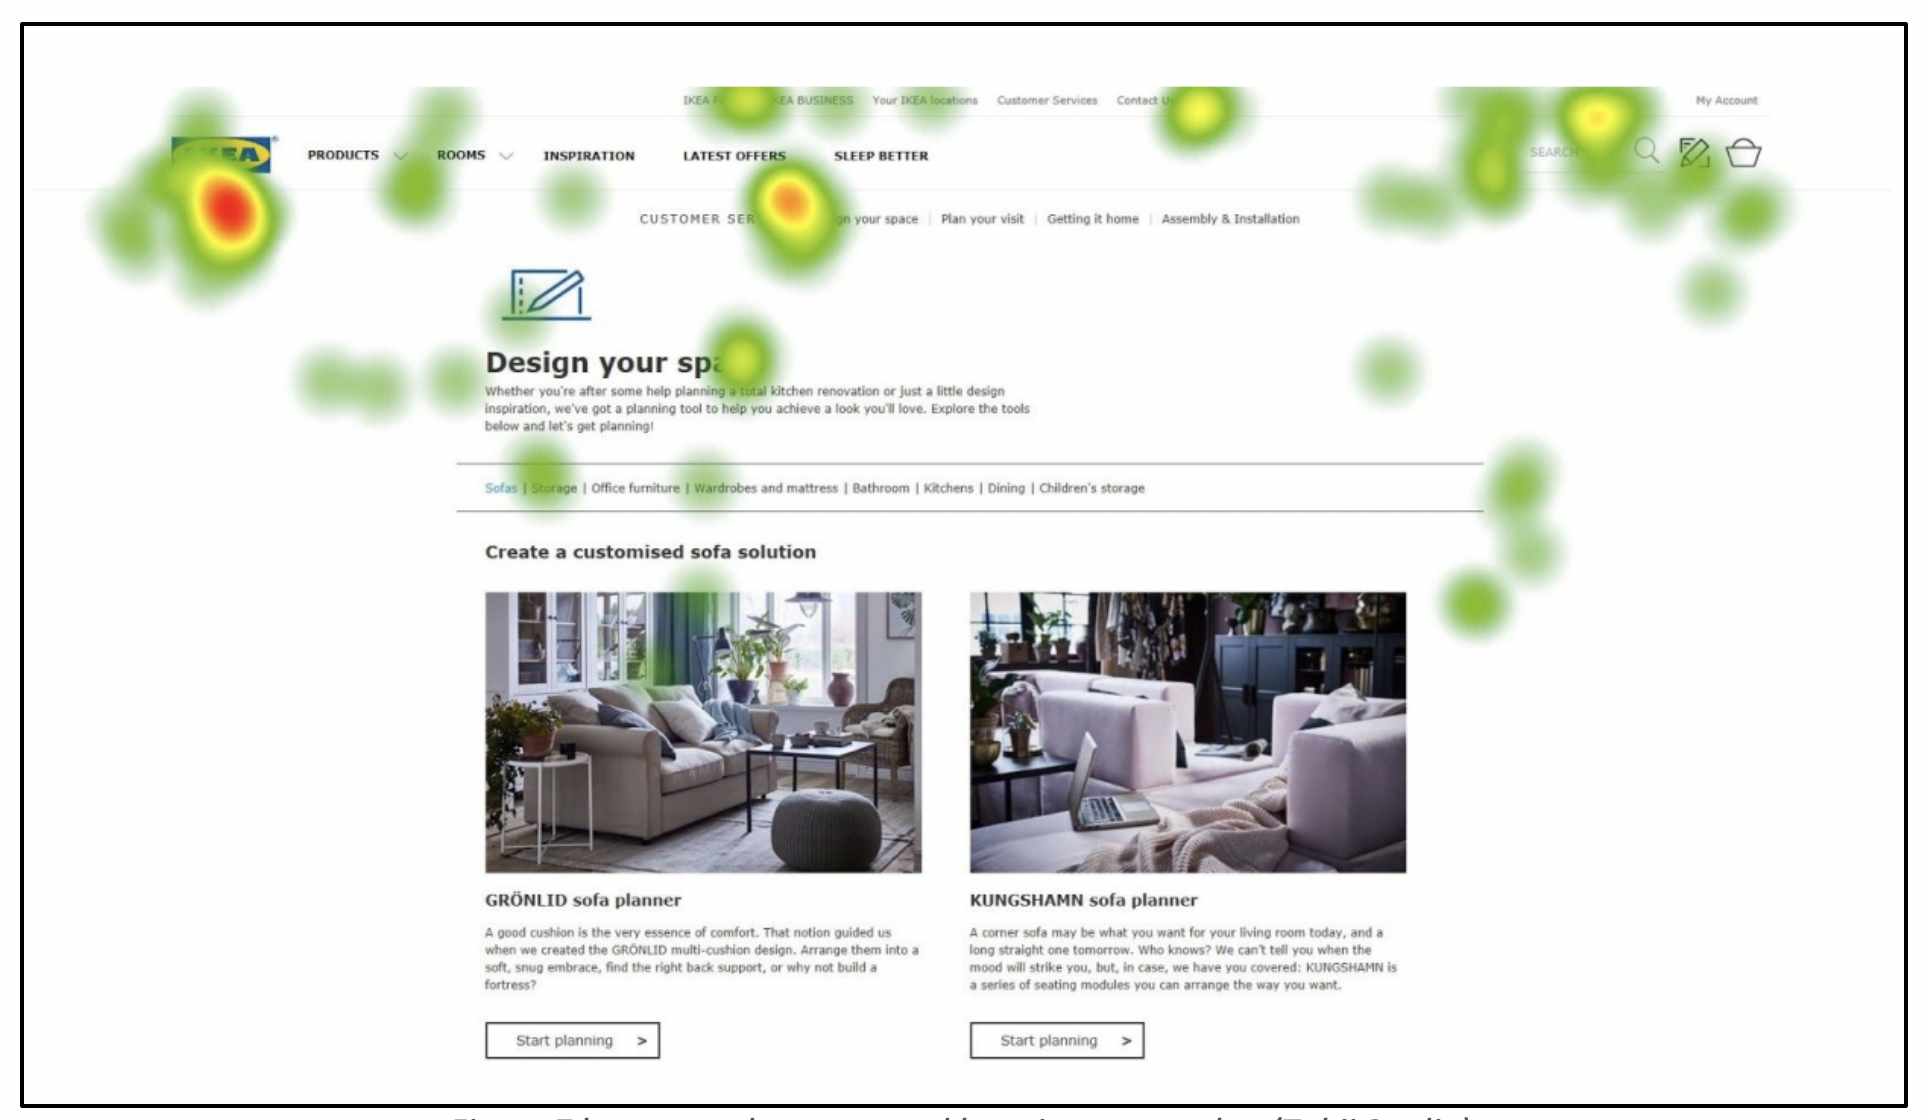
Heat map data
Heat map data captured by eye tracker
Heat map shows how the gaze was distributed over the web page. This qualitative data were really different with gaze map, since it did not display the order. Red colour indicated the user was more longer spending their time to see on that area rather than green colour.
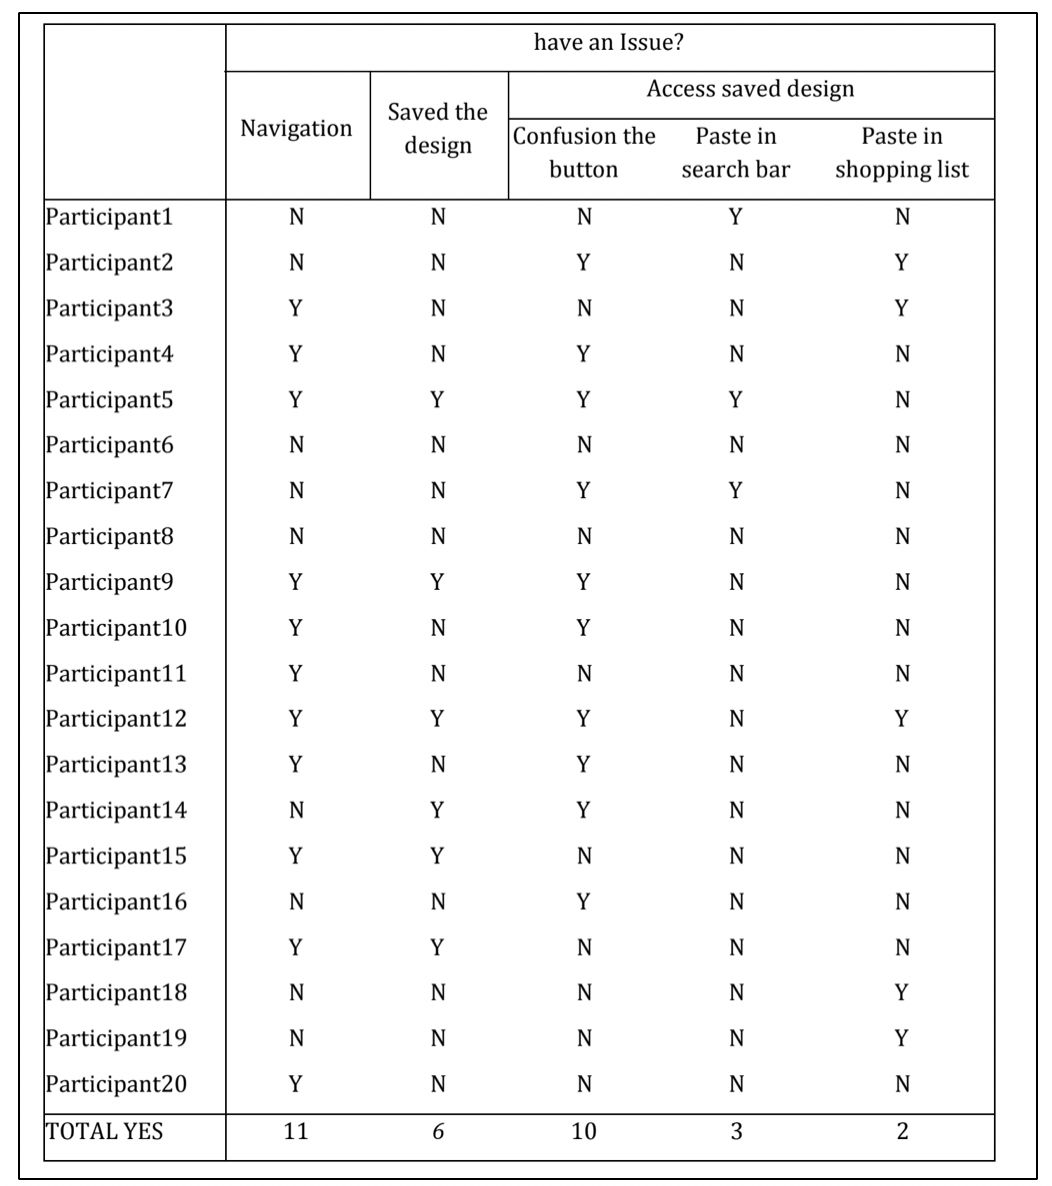
Issues based on quantitative data
The issues in the table below were already simplified and we already calculated the number of participants who were facing the issues*. As a result, we got the quantitative data that can support our findings.
*Y indicates participant got the issue, while N indicates they were not getting the issue
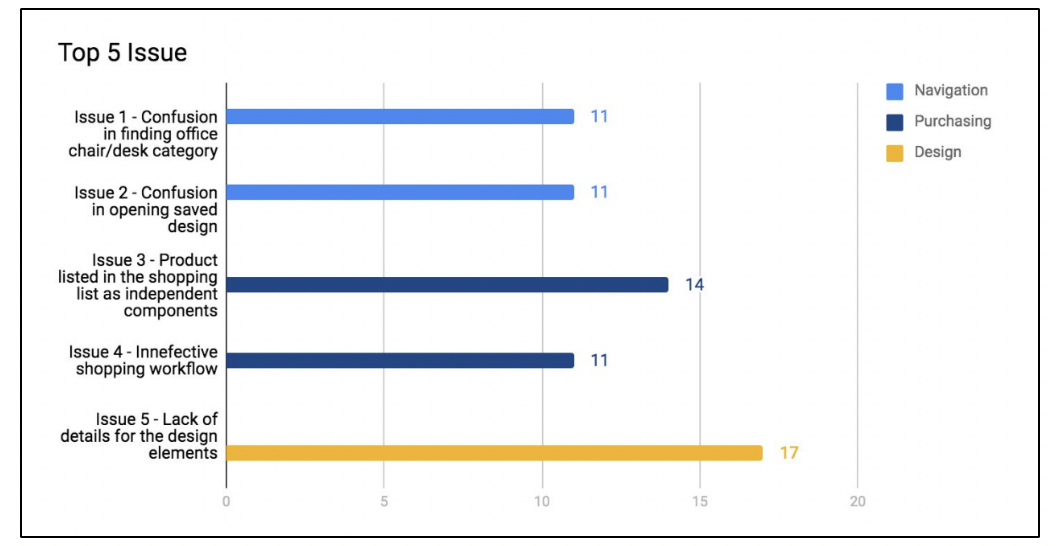
Key findings
We collected and analysed both qualitative and quantitative data, then came up with 5 important issues. These top issuesrepresent the user's issues during the test. We also categorize every issues, so we can classify them into navigation, purchasing and design.
Findings and Recommendations
We explained findings and recommendations for every issue that have raised before, and we added quantitative and qualitative data for support the findings. Also, we delivered the impacts of users for informing the importance of this issues to the IKEA's company. Below is the preview of the findings and recomendations that we raised;
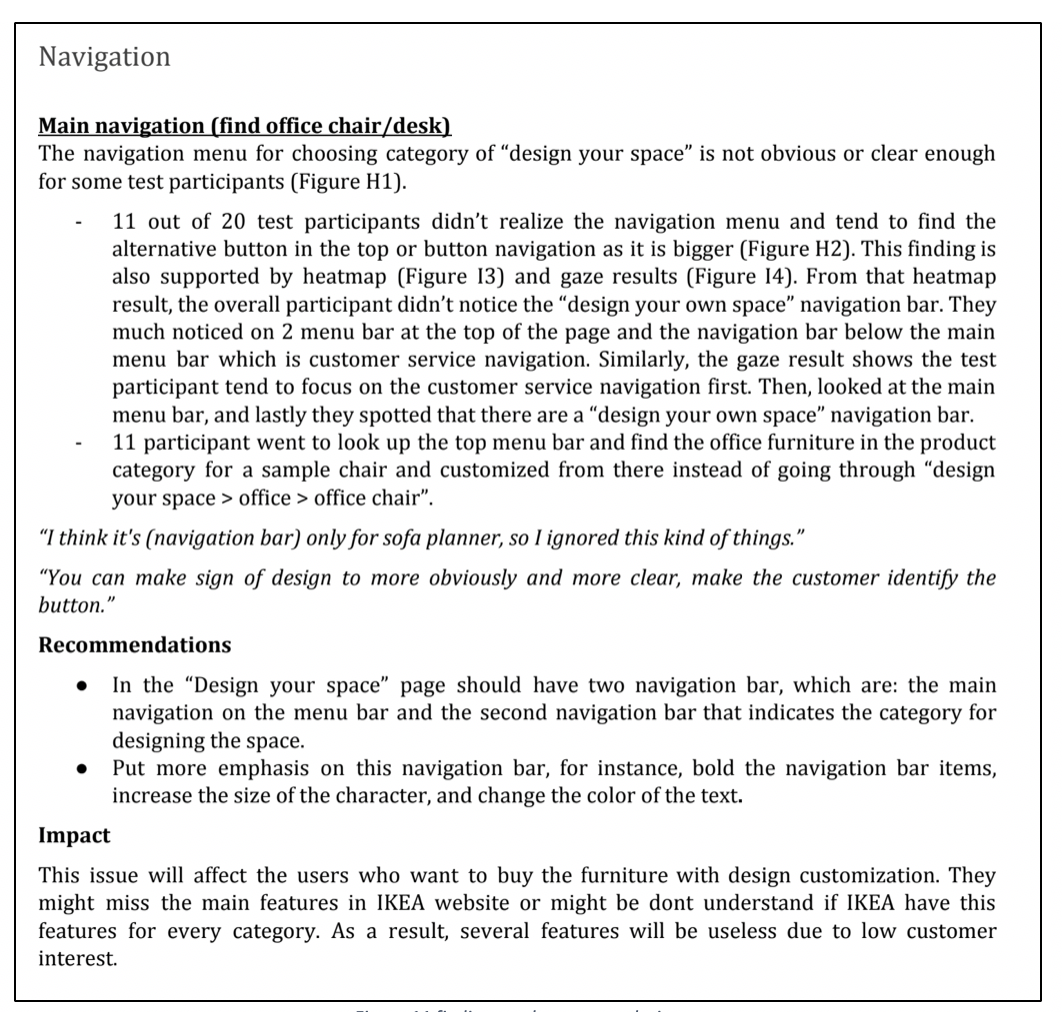
Previews of findings and recommendations